Pivots in Engage are a cross-reference display of bandings. Adding data to a pivot creates a single display to summarize data trends, customer segments, and transaction hotspots. You can also add rules to the pivot domain to refine your data.
Adding data to a pivot
-
Click the + icon in the navigation pane to open the create menu and choose pivot from the element list.
-
Expand your database to view available bandings.
-
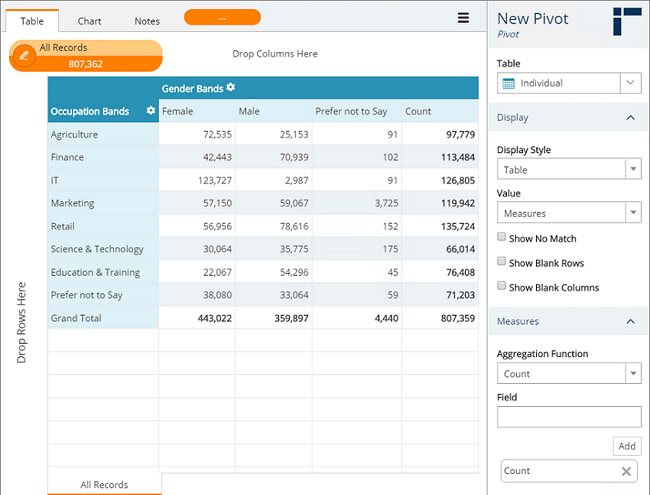
The pivot workspace includes drop zones for columns and rows. Drag-and-drop the banding that will form your columns into the columns drop zone.
-
Drag-and-drop the banding that will form your rows into the rows drop zone.
-
Continue adding bandings as required. To switch axis, drag the banding names to the alternative axis.
-
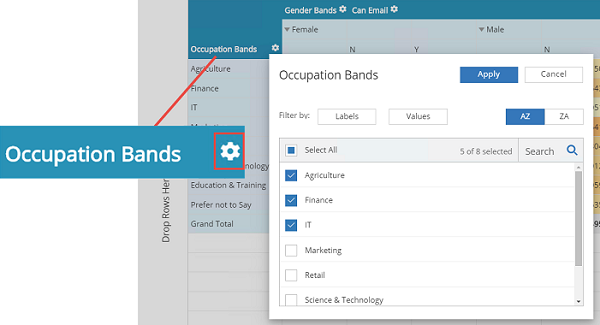
To filter or omit values, select the banding name cog icon and make the required selections.
-
Use the pivot properties pane to customize your pivot.
-
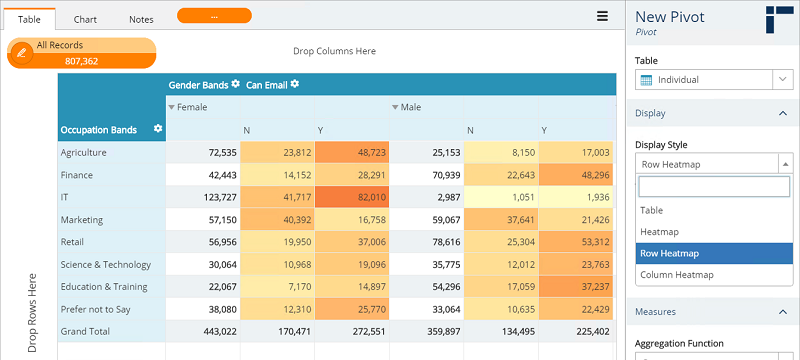
Switch between table (numbers) and heatmap view using the display style dropdown.
-
Switch between measures (numbers) or view the values as either row, column or grid percentage totals.
-
Check options to hide empty or uncategorized values.
-
Switch between viewing counts of records (default), and sum, average, and min/max values from any numeric data field on the display summary.
-
Set a limit on the records visible within the pivot.
-
-
With your pivot built, you can use additional pivot tools to conduct further analysis.
Adding a domain
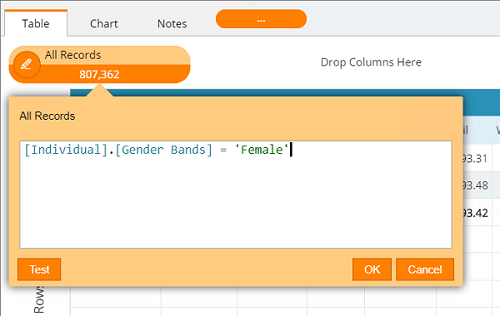
Domains are configured in the top left corner of your workspace and allow you to configure a master rule that manages which records enter a pivot, e.g. you may want your pivot data to only include female customers.
To add a domain:
-
Expand the lozenge to open the query text box.
-
Drag a query from your database to the text box or type a query.
-
Use the test button to verify your syntax.
-
Click OK to add the rule to your pivot.